Events & Seasons · November 18, 2026
Cabo weather by month: temperatures, sea temperature and rain
Los Cabos is hot and very dry: average daytime highs run from 80F (26.6C) in January to 94F (34.7C) in August, and the Cabo San Lucas station records 10.4 in (265 mm) of rain in an entire year. Nearly three quarters of that rain falls in August and September alone (195.1 of 265 mm), which leaves the other ten months close to rainless.
At a glance
Cabo San Lucas month by month
Climate normals for the 1991 to 2020 period at the Cabo San Lucas station, with Fahrenheit and inches first and metric in brackets. This page is the data, not a recommendation about dates: for that, see the best time of year to visit San Jose del Cabo.
| Month | Average high | Average low | Sea temperature | Rain | Rainy days |
|---|---|---|---|---|---|
| January | 80F (26.6C) | 55F (12.8C) | 74F (23.1C) | 0.2 in (6.0 mm) | 0.8 |
| February | 81F (27.0C) | 55F (12.9C) | 72F (22.1C) | 0.2 in (4.7 mm) | 0.5 |
| March | 83F (28.5C) | 57F (13.9C) | 71F (21.5C) | 0.1 in (1.4 mm) | 0.2 |
| April | 86F (30.1C) | 60F (15.4C) | 70F (21.3C) | 0.0 in (0.0 mm) | 0 |
| May | 90F (32.1C) | 62F (16.5C) | 72F (22.2C) | 0.0 in (0.1 mm) | 0.1 |
| June | 91F (32.6C) | 65F (18.5C) | 74F (23.2C) | 0.0 in (0.4 mm) | 0.1 |
| July | 94F (34.4C) | 72F (22.5C) | 79F (26.4C) | 0.3 in (7.8 mm) | 1 |
| August | 94F (34.7C) | 75F (23.8C) | 83F (28.4C) | 3.4 in (85.1 mm) | 3.6 |
| September | 93F (33.7C) | 74F (23.3C) | 84F (28.7C) | 4.3 in (110.0 mm) | 4 |
| October | 92F (33.4C) | 70F (21.2C) | 84F (28.7C) | 1.0 in (25.3 mm) | 1.4 |
| November | 87F (30.4C) | 64F (17.5C) | 81F (27.0C) | 0.7 in (16.9 mm) | 1.1 |
| December | 81F (27.4C) | 57F (14.0C) | 77F (25.0C) | 0.3 in (7.3 mm) | 0.7 |
Sea temperature through the year
The water lags the air by a couple of months. It is at its coldest in spring, when the land is already warm, and at its warmest in early autumn.
Jan
74F (23.1C)
Feb
72F (22.1C)
Mar
71F (21.5C)
Apr
70F (21.3C)
May
72F (22.2C)
Jun
74F (23.2C)
Jul
79F (26.4C)
Aug
83F (28.4C)
Sep
84F (28.7C)
Oct
84F (28.7C)
Nov
81F (27.0C)
Dec
77F (25.0C)
Sea temperature is a single NOAA grid cell just off Cabo San Lucas at 22.875N 109.875W, so the same series applies to both towns.
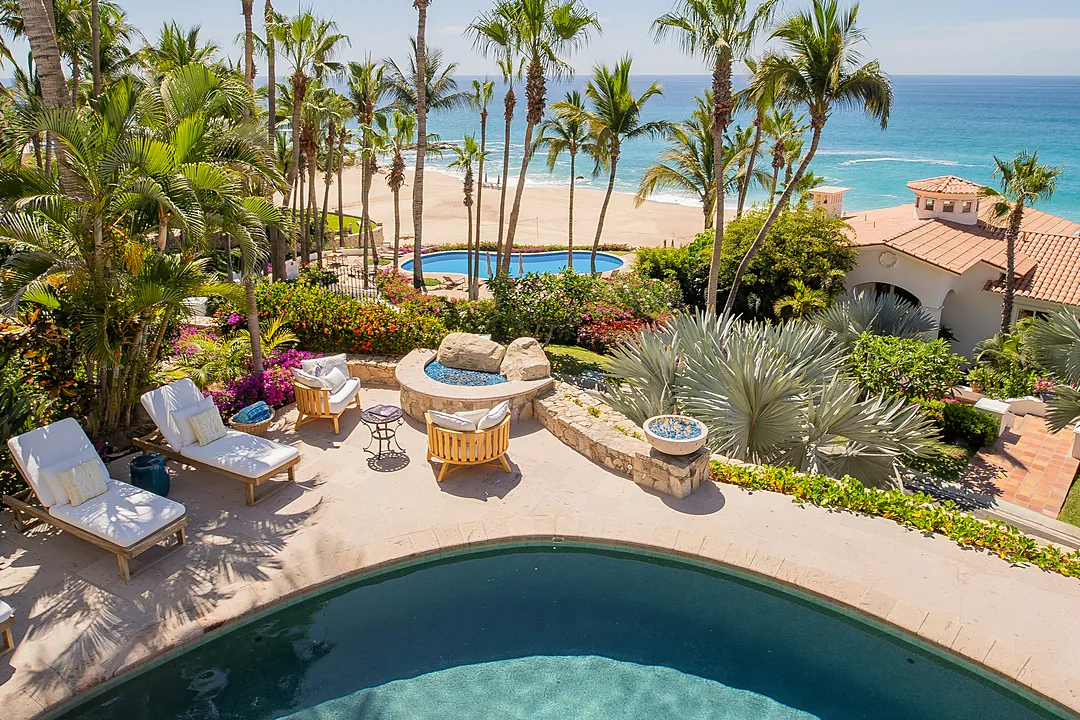
The sea peaks at 84F (28.7C) in September and October and bottoms out at 70F (21.3C) in April.
Good to know
The four parts of the Cabo year
Each season defined by the numbers in the table above, not by the calendar quarters.
Winter, December to March
Average highs of 80F to 83F (26.6 to 28.5C) with lows of 55F to 57F (12.8 to 14.0C). Rain is close to absent: 0.1 in (1.4 mm) across 0.2 days in March. The sea is cooling the whole time, from 77F (25.0C) in December to 71F (21.5C) in March, on its way to the April low. December on its own is covered in Cabo in December.
Spring, April to June
The land heats fast while the water stays cold. Highs climb from 86F (30.1C) in April to 91F (32.6C) in June, and the sea sits at 70F (21.3C) in April before recovering to 74F (23.2C) in June. April averages 0.0 in (0.0 mm) of rain and zero days with rain, and March through June total under 2 mm between them.
Summer, July to September
Highs of 94F (34.4C) in July and 94F (34.7C) in August, with overnight lows that no longer drop below 72F (22.5C). The water is at its warmest of the year, 83F (28.4C) in August and 84F (28.7C) in September. This is also when the rain arrives: 3.4 in (85.1 mm) in August and 4.3 in (110.0 mm) in September, over 3.6 and 4 days respectively.
Storm season, 15 May to 30 November
The official eastern Pacific hurricane season overlaps the summer and runs into late autumn. By October the station still records a 92F (33.4C) average high and an 84F (28.7C) sea with 1.0 in (25.3 mm) of rain over 1.4 days, and November falls back to 87F (30.4C) with 0.7 in (16.9 mm) over 1.1 days.
How San Jose del Cabo differs from Cabo San Lucas
The two stations are about 20 miles apart and the second one, SMN 3056 at San Jose del Cabo, is hotter by day and, in winter, cooler by night. July and August average 96F (35.4C) there against 94F (34.4C) and 94F (34.7C) at Cabo San Lucas, and the January overnight low is 53F (11.6C) against 55F (12.8C). Every month of the year is warmer in the afternoon on the San Jose side.
Rain is the bigger difference. San Jose del Cabo averages 14.0 in (356 mm) a year to Cabo San Lucas's 10.4 in (265 mm), but across fewer wet days, 12.8 against 13.5. September is the clearest case: 6.6 in (167.8 mm) at San Jose del Cabo and 4.3 in (110.0 mm) at Cabo San Lucas. November diverges too, 1.7 in (42.4 mm) against 0.7 in (16.9 mm). When it rains on this coast it tends to rain hard and briefly, and the eastern end of the corridor catches more of it. Villas in San Jose del Cabo sit on that side of the arch.
One caution on the overnight numbers. Both stations sit in town, a short way inland, and nights directly on the water are usually a little milder than the station low suggests. Sea temperature is identical in both tables because it comes from one NOAA grid cell offshore rather than from either station.

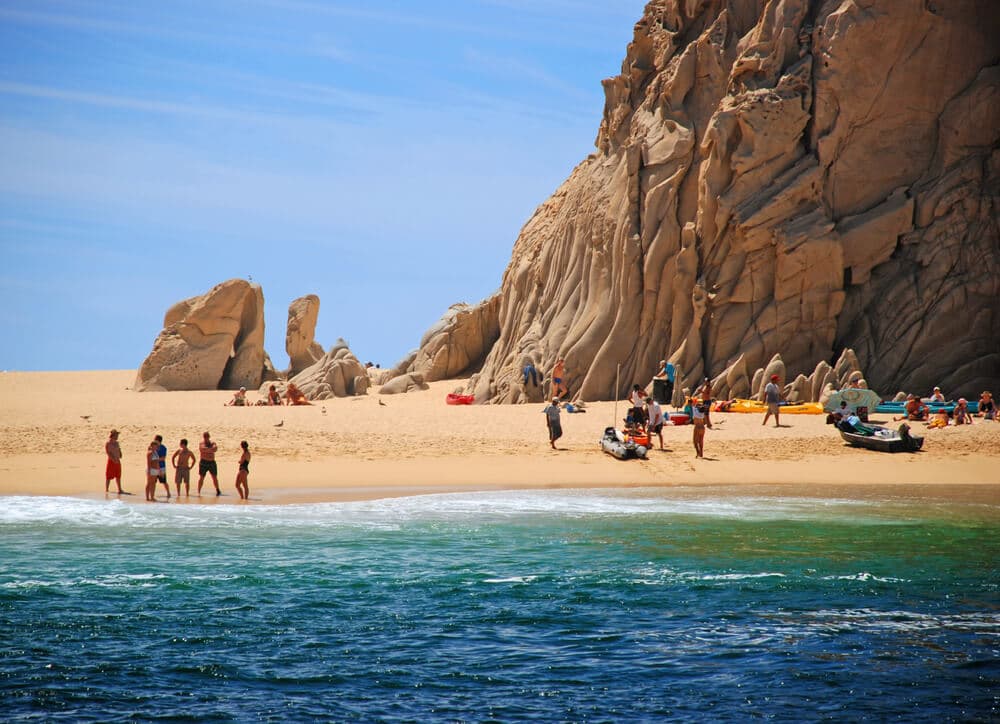
Pacific swell on the Cabo coast. The eastern Pacific hurricane season officially runs 15 May to 30 November.
Storm season and what the records show
The U.S. National Hurricane Center dates the eastern Pacific hurricane season 15 May to 30 November. Most of those months are dry at both stations. The risk is concentrated at the back end of summer, which is also where the rainfall normals concentrate.
The station records show how lopsided this climate is. The wettest single day ever recorded at Cabo San Lucas is 400 mm (15.7 in) on 31 August 2017, during Tropical Storm Lidia, and the wettest month is 452 mm (17.8 in), August 2017. Both figures exceed the 265 mm the station averages in a full year. San Jose del Cabo's wettest month is 628 mm (24.7 in) in November 1993, and its wettest single day is 340 mm (13.4 in) on 1 September 1998. Hurricane Odile made landfall near Cabo San Lucas on the night of 14 September 2014 as a Category 3 hurricane. The heat record is from the same part of the calendar: 44C (111F) at Cabo San Lucas on 16 September 2005, against a coldest reading of 1.5C (35F) on 1 February 1991.
The mainland coast runs on a different cycle. Our Punta Mita villas sit on Banderas Bay rather than in Baja, where the pattern is dry and sunny from November to May and hot, humid and rainy from June to October. The figures on this page are Baja station figures and do not apply there.
Good to know
What to pack by season
Packing follows the gap between the daytime high and the overnight low, which is widest in winter and nearly closed in summer.
December to March
Daytime is shirtsleeves at 80F to 83F (26.6 to 28.5C), but the station lows of 55F to 57F (12.8 to 14.0C) mean a real sweater or jacket for dinner outside. The sea is 71F to 77F (21.5 to 25.0C), cool enough that swimmers often want a rash guard, and a heated pool matters more than people expect, which is worth checking when you choose among our Los Cabos villas.
April to June
Hot and rainless: 86F to 91F (30.1 to 32.6C) by day with April at 0.0 in (0.0 mm) and zero rain days. Sun protection and a hat do more work than a rain layer. The water is at its coldest of the year, 70F (21.3C) in April, so pack a wetsuit top if you plan long swims or dives.
July to September
Linen and not much of it. Highs of 93F to 94F (33.7 to 34.7C) and lows that stay at 72F to 75F (22.5 to 23.8C) mean no evening layer is needed. Add a light rain shell and shoes you do not mind soaking: August brings 3.4 in (85.1 mm) over 3.6 days and September 4.3 in (110.0 mm) over 4 days.
October to November
The warmest water of the year with falling air temperatures, 84F (28.7C) sea in October and 81F (27.0C) in November against highs of 92F (33.4C) then 87F (30.4C). Swim gear stays out, and one light layer covers the 64F to 70F (17.5 to 21.2C) nights. November rain is modest but real at Cabo San Lucas, 0.7 in (16.9 mm) over 1.1 days, and heavier at San Jose del Cabo, 1.7 in (42.4 mm).
Sources
Air temperature, rainfall and rain days come from the Servicio Meteorologico Nacional, Mexico's national weather service under CONAGUA, climate normals for 1991 to 2020, stations 3005 Cabo San Lucas and 3056 San Jose del Cabo. Sea temperature comes from the NOAA Optimum Interpolation Sea Surface Temperature product (OISST v2.1), monthly means for 1991 to 2020. Storm season dates and the Odile landfall are from the U.S. National Hurricane Center. The Fahrenheit and inch figures on this page are rounded conversions of those values.
Good to know
Frequently Asked Questions
How warm is the sea in Cabo?+
It ranges from 70F (21.3C) in April, its coldest month, to 84F (28.7C) in September and October. January is 74F (23.1C) and December 77F (25.0C). The series is a NOAA grid cell just off Cabo San Lucas, so the same numbers apply to San Jose del Cabo. For a bay calm enough to swim in at any of those temperatures, see Palmilla.
When does it rain in Cabo?+
August and September. Cabo San Lucas averages 3.4 in (85.1 mm) over 3.6 days in August and 4.3 in (110.0 mm) over 4 days in September, which is nearly three quarters of the yearly 265 mm. April averages 0.0 in (0.0 mm) and zero days with rain, and March through June together total under 2 mm.
How hot does it get in summer?+
Average highs reach 94F (34.7C) in August at Cabo San Lucas and 96F (35.4C) in July and August at San Jose del Cabo. The hottest reading on record at the Cabo San Lucas station is 44C (111F), on 16 September 2005.
When is hurricane season in Cabo?+
The eastern Pacific hurricane season officially runs 15 May to 30 November, per the U.S. National Hurricane Center. Hurricane Odile made landfall near Cabo San Lucas on the night of 14 September 2014 as a Category 3 hurricane, and the station's wettest day on record, 400 mm (15.7 in), came with Tropical Storm Lidia on 31 August 2017.
Stay here
Villas near this story
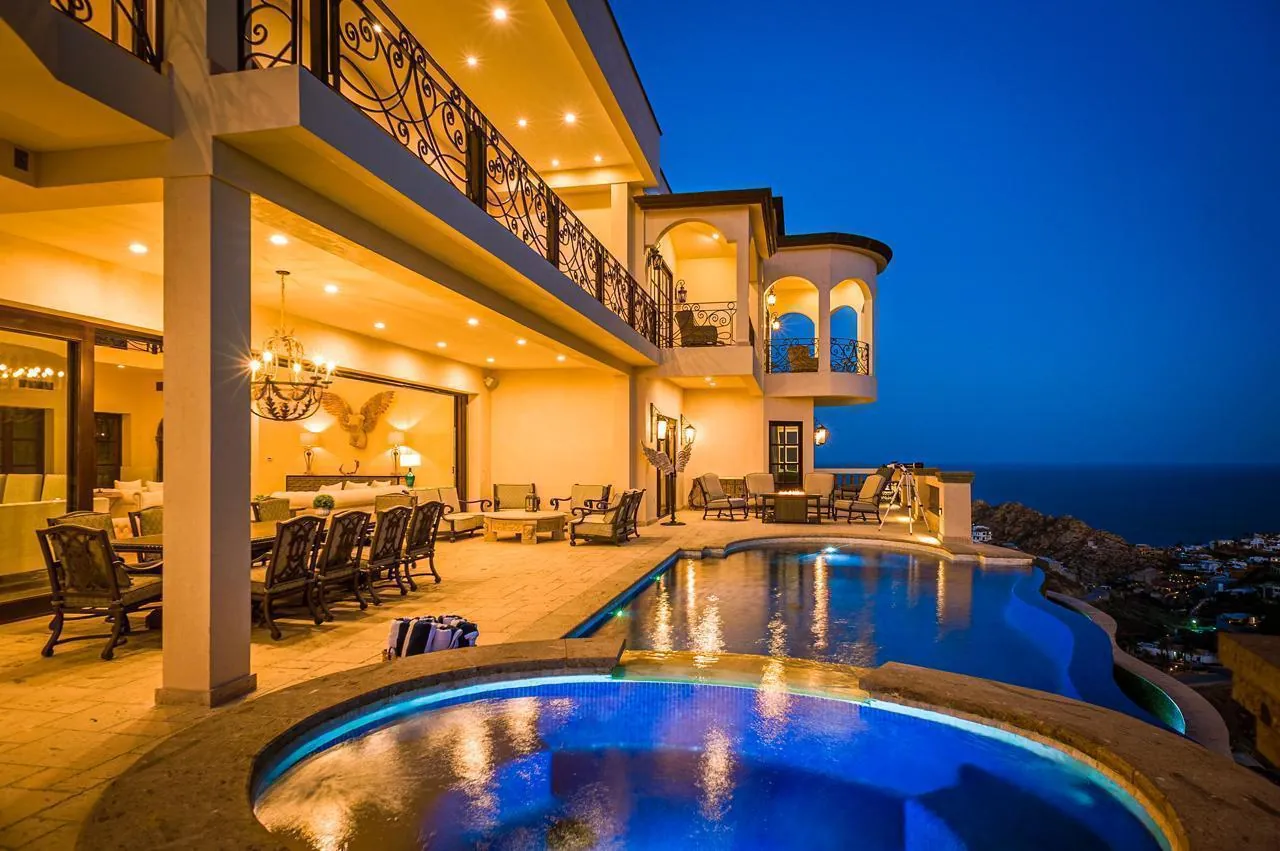
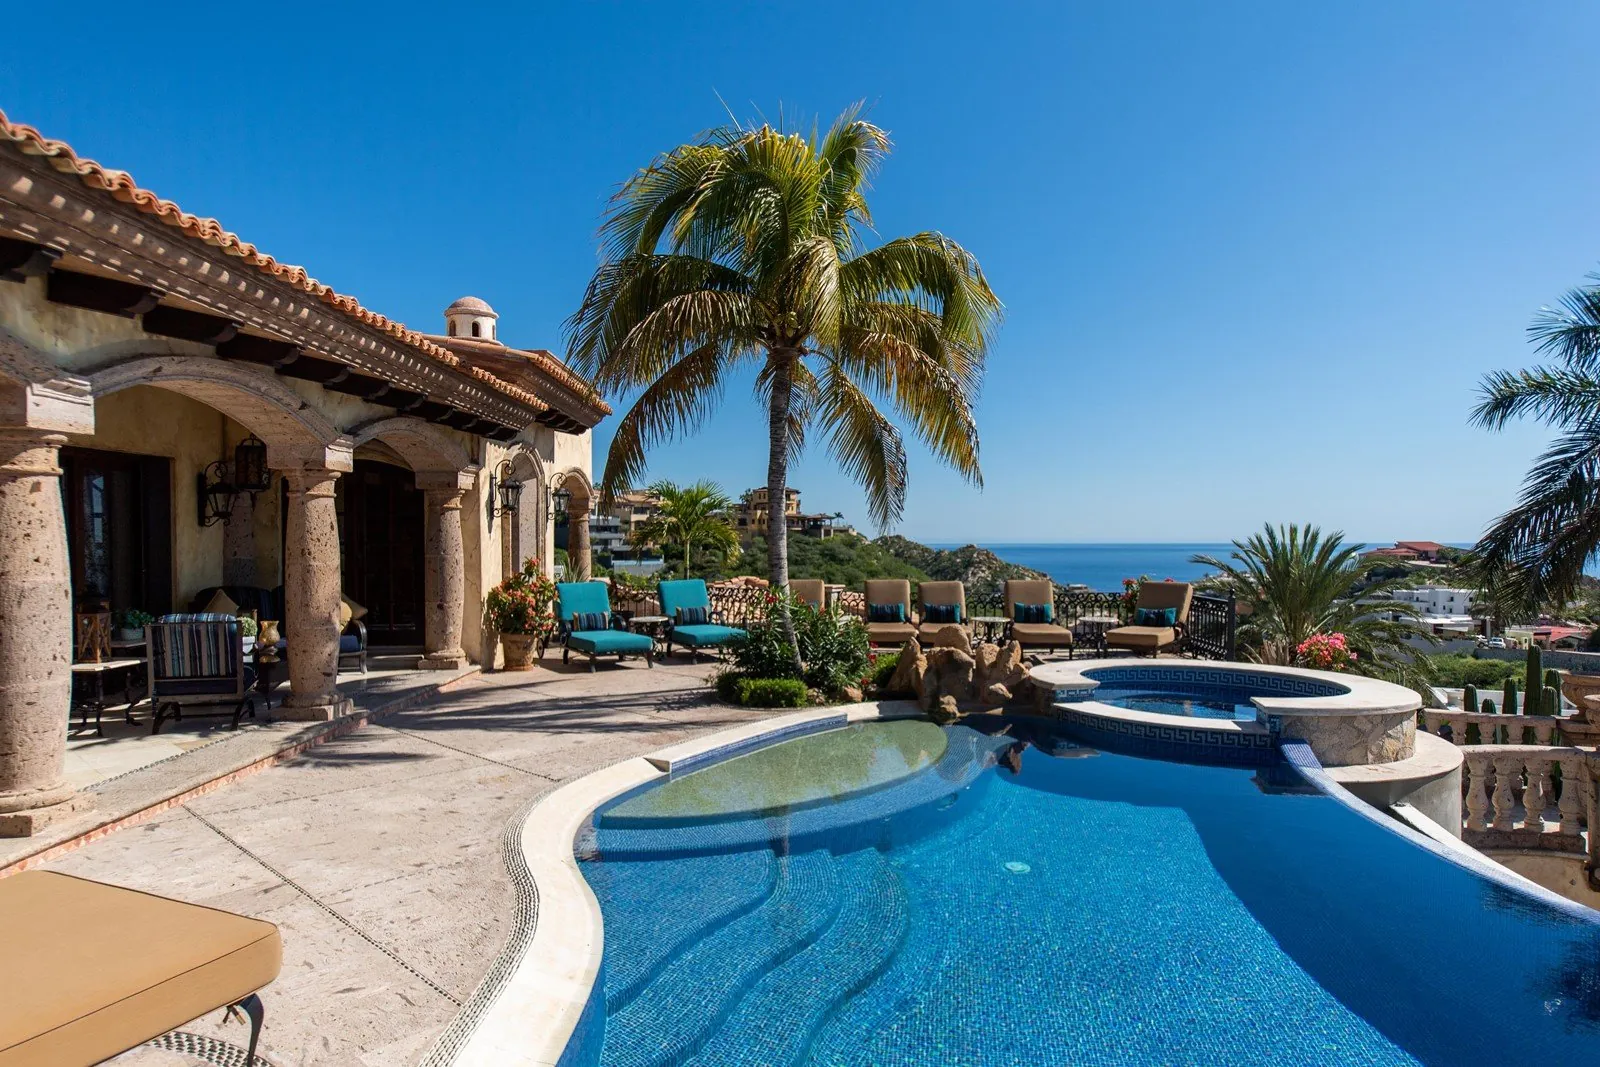
Every stay includes a private chef and a dedicated concierge. Browse all Cabo San Lucas villas.